Syllabus (Fourth Edition, 2023)
Topics
i. Describe the principles behind the electrocardiogram (ECG).
ii. Describe the invasive and non-invasive measurement of blood pressure, including limitations, potential sources of error and the need for calibration.
iii. Describe the methods of measurement of cardiac output including limitations, potential sources of error, the need for calibration and the values obtained.
Topics not covered in previous SAQs
.
Learning Objectives for the First Part Examination in Intensive Care Medicine
- This will ensure that trainees, tutors, and examiners can work from a common base.
- All examination questions are based around this Syllabus.
- These learning objectives are designed to outline the minimum level of understanding required for each topic.
- The accompanying texts are recommended on the basis that the material contained within them provides sufficient information for trainees to meet the learning objectives.
- Trainees are strongly encouraged to explore the existing and evolving body of knowledge of the Basic Sciences as they apply to Intensive Care Medicine by reading widely.
- For all sections of the syllabus an understanding of normal physiology and physiology at extremes of age, obesity, pregnancy (including foetal) and disease (particularly critical illness) is expected.
- Similarly, for pharmacology, trainees are expected to understand a drug’s pharmacology in these contexts.
- An understanding of potential toxicity and relevant antidotes is also expected.
Definitions
Throughout the document specific wording has been used under the required abilities to indicate the level of knowledge and understanding expected and a glossary of these terms is provided.
Definitions
| Calculate | Work out or estimate using mathematical principles. |
| Classify | Divide into categories; organise, arrange. |
| Compare and contrast | Examine similarities and differences. |
| Define | Give the precise meaning. |
| Describe | Give a detailed account of. |
| Explain | Make plain. |
| Interpret | Explain the meaning or significance. |
| Outline | Provide a summary of the important points. |
| Relate | Show a connection between. |
| Understand | Appreciate the details of; comprehend. |
SAQs
i. Describe the principles behind the electrocardiogram (ECG).
2023A 17
Explain the following components of an electrocardiogram (ECG) machine; electrodes, leads, amplifiers and filters. (70% of Marks) Outline methods employed to reduce artefact. (30% of Marks)
2021B 17
Explain the components of an ECG (electrocardiogram) monitor (70% marks). Outline the methods employed to reduce artefact (30% marks).
2016A 09
Describe the essential components of an ECG monitor (80% of marks). Outline the methods employed to reduce artefact (20% of marks).
2011B 05
Describe the essential components of an ECG monitor (60% marks). Outline the methods employed to reduce artefact (40% marks).
CICMWrecks Answer
ECG
- 12 electrodes on the body surface to detect small potentials (0.5-2 mV) generated by the heart.
- Electrodes made of Ag/AgCl
- ECG signals detected by these electrodes
- Sent to electronic device that filters out noise and boosts the signal
- Displayed on oscilloscope
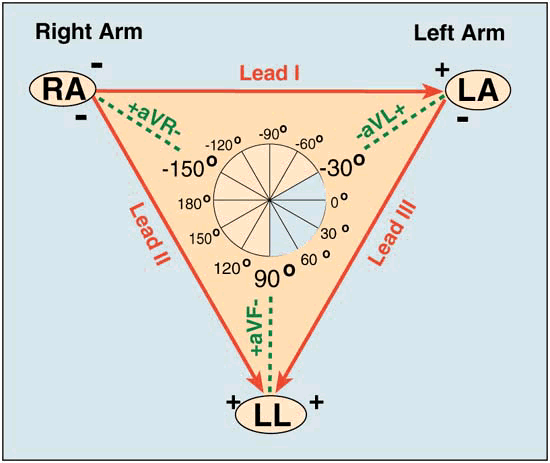
Signal Interpretation from oscilloscope readings via Enthoven’s triangle
- For orientation of the Bipolar and unipolar limb leads synthesised from the 12-lead ECG.
- Bipolar limb leads
- Lead I: RA (-) to LA (+) at 0°
- Lead II: RA (-) to LL (+) at 60°
- Lead III: LA (-) to LL (+) at 120°
- Unipolar limb leads
- aVR: RA (+) at -150°
- aVL: LA (+) at -30°
- aVF: LL (+) at 90°
- Positive deflection in a lead indicates depolarisation wave moving towards lead’s positive terminal
Calibration
- Vertical calibration
- 1 mV signal → vertical deflection of 10 mm (2x large square or 10x small squares)
- 0.1 mV per mm (or small square)
- Horizontal calibration
- paper speed is 25 mm/s → 0.04 s/mm (or small square)
Errors:
Noise and interference caused by:
- Electrical interference by any device using AC current (esp high-frequency diathermy)
- → Minimise by ECG filters, shielding of leads/cables, differential amplifers, Etc.
- Movement or shivering
- → minimised by placement over bony prominences and use of ECG filters
- High skin impedance
- → minimised by degreasing skin with EtOH and use of conducting gel with electrodes
- Incorrect electrode placement relative to heart
It looks like this Examiner reads Hemmings.
Gladwin 2016
Examiner Comments
2023A 17: 39% of candidates passed this question.
Good answers described electrode components, intensity of signals measured (requirement for and levels of amplification), lead position and differences between unipolar and bipolar leads. Rationale and mechanisms of filtering were less well described. Description of highand low-pass filtering along with detail on monitoring and diagnostic modes scored marks. Patient-related, electrical and environmental methods of reducing artefact attracted marks.
2021B 17: 46% of candidates passed this question.
Excellent answers described the function of the ECG device and its components. Components include electrodes, which form leads (unipolar and bipolar), the amplifier and an output device. The process of amplification and filtering (e.g., high and low pass filters), as well as monitoring and diagnostic ECG modes were described. A comprehensive list of ways to reduce artefacts, including strategies to address both patient and equipment factors was generally provided.
2016A 09: 50% of candidates passed this question.
The ECG device detects and amplifies the small electrical changes on the skin that are caused when the heart muscle depolarizes (0.5 – 2 mV). This is reflected as rises and falls in the voltage between two electrodes placed either side of the heart which is displayed either on a screen or on paper. Usually more than 2 electrodes are used and they can be combined into a number of pairs (For example: Left arm (LA), right arm (RA) and left leg (LL) electrodes form the three pairs LA+RA, LA+LL, and RA+LL). The output from each pair is known as a lead. Each lead is said to look at the heart from a different angle.
Electrodes are commonly made of silver or silver chloride components that are attached to the main unit of the machine. Most ECG machines use 12 electrodes. Better answers made mention of the two lead types: unipolar and bipolar.
Methods to reduce artefact include improving signal detection (conductive paste, skin preparation (dry, no hair, etc.)) and minimizing external electrostatic forces (common earthed environment, diathermy, etc.,) or patient environment (avoid shivering).
The amplifier has three essential functions: High input impedance so as to minimize signal loss and reject interference (50 – 60 Hz), differential amplification, (to amplify the potential difference detected by the skin electrodes), and high common mode rejection (e.g. > 50Hz) to aid eliminating muscle artefact or electrical interference from the power grid.).
Vector analysis is not a component of the ECG machine and so was not required to answer the question.
2011B 05: 2 (8%) of candidates passed this question.
Monitoring and monitors are essential to Intensive Care practice, and is the reason why it is included in the syllabus. Unfortunately candidates have performed poorly in this question, as they have in previous measurement and monitoring questions. Future candidates need to be aware that such questions WILL get asked again.
For a good answer it was expected that mention would be made of what an ECG monitors does (ie detects and amplifies the small electrical changes on the skin that are caused when the heart muscle depolarizes), how (ie use of 2 or more electrodes, typically being made of silver or silver chloride), the type of leads (ie unipolar and bipolar, and a description of the latter), the way the signal is handled (isolation, amplification, gain, filtering) and displayed. Methods to reduce artefact and improve signal:noise ratio, should have included skin conductive measures, minimising external interference (filters, earthing), common mode signal artefact rejection, high input impedance amplification and mention of diagnostic and monitoring modes.
Syllabus: S2a
Recommended sources: Davis and Kenny pgs 160-178, also Sykes & Vickers Principles in measurement and monitoring in Anaesthesia and Intensive Care, Chps 4, 5, 6, 23.
ii. Describe the invasive and non-invasive measurement of blood pressure, including limitations, potential sources of error and the need for calibration.
2019A 02
Outline the components required to measure blood pressure from an intra-arterial catheter (75% of marks). What information (other than blood pressure) may be gained from an arterial line trace (25% of marks)?
CICMWrecks Answer
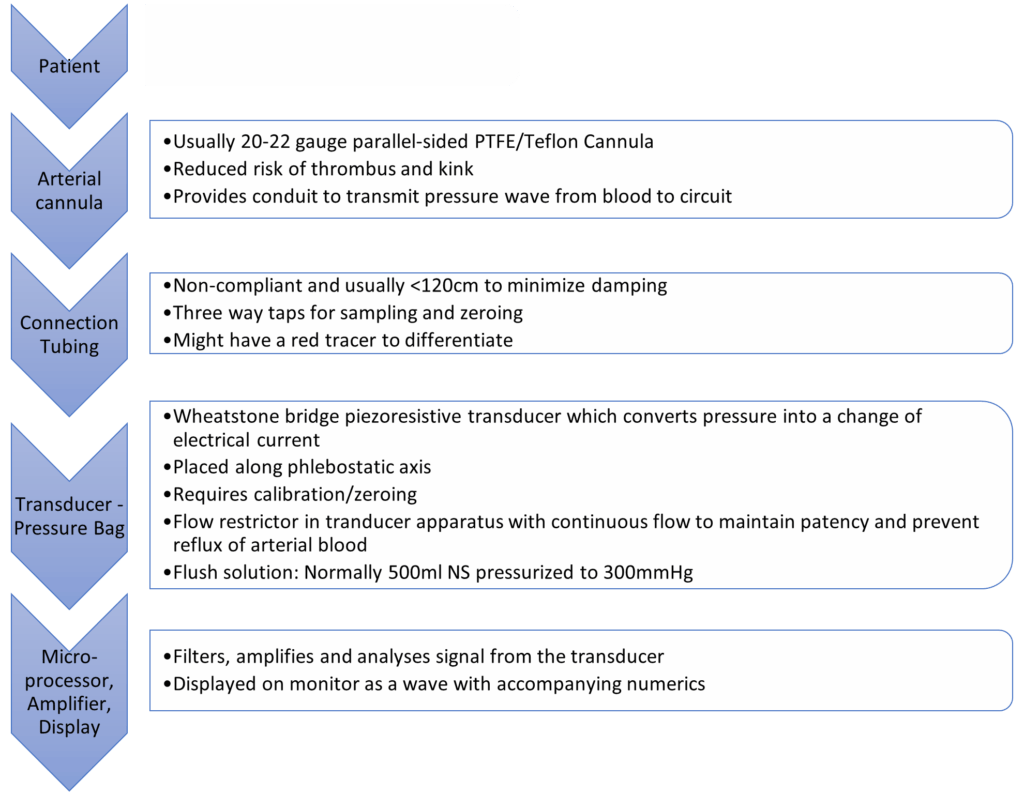
Process
- BP pulsations transmitted from arterial cannula up the tubing to transducer
- Woks by hydraulic coupling between blood and saline
- Transducer converts pressure waves to electrical signals (via strain gauge and wheatstone bridge)
- Signal amplified and displayed on monitor
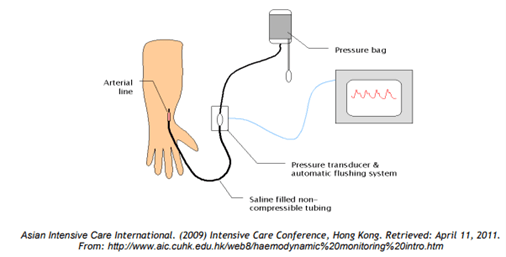
Information which may be gained from an arterial line trace:
- Normal trace
- Pulse rate and rhythm
- Arrhythmias
- Morphology:
- Slow rising in AS
- Steepness of ascending phase:
- Increased: Inc Systemic vascular resistance, vasopressors, inc contractility
- Decreased: Septic shock, vasodilators
- Dicrotic ‘fall-off’ : changes with changes in SVR
- Variation with insertion site: Further from aorta: taller systolic peak, delayed dicrotic notch, lower end diastolic pressure, later arrival of pulse
- Dampened trace
- Kinks/bubbles/clots
- Overly compliant tubing
- Hyperactive trace
- Noncompliant tubing, reverberations, increased vascular resistance
- Arterial line swing
- Reduction in venous return
- Hyperexpansion of lungs
- Pulse pressure variation (~fluid responsiveness)
- Pulsus alternans in tamponade
- Adjuncts: Pulse contour analysis with PICCO / other devices
JC 2019
Examiner Comments
2019A 02: 44% of candidates passed this question.
Most of the marks were allocated to the components of the measuring system (as detailed in the question), hence a level of detail was required. An explanation of how the various components work was required; e.g. hydraulic coupling and transducers. Some candidates forgot to include heart rate as a piece of information derived from the trace.
2022B 10 – 2016B 17
Draw a labelled diagram of both the aortic root and radial artery pressure waveforms in a young adult using the same axis (60% of marks).
Explain the factors that account for the differences between these two waveforms (40% of marks).
CICMWrecks Answer
The arterial pulse waveform:
- The arterial pulse waveform can be separated into three distinct components
- The systolic phase, characterised by a rapid increase in pressure to a peak, followed by a rapid decline. This phase begins with the opening of the aortic valve and corresponds to the left ventricular ejection
- The dicrotic notch, which represents the closure of the aortic valve
- The diastolic phase, which represents the run-off of blood into the peripheral circulation.
Windkessel effect
is a term used in medicine to account for the shape of the arterial blood pressure waveform in terms of the interaction between the stroke volume and the compliance of the aorta and large elastic arteries (Windkessel vessels) and the resistance of the smaller arteries and arterioles.
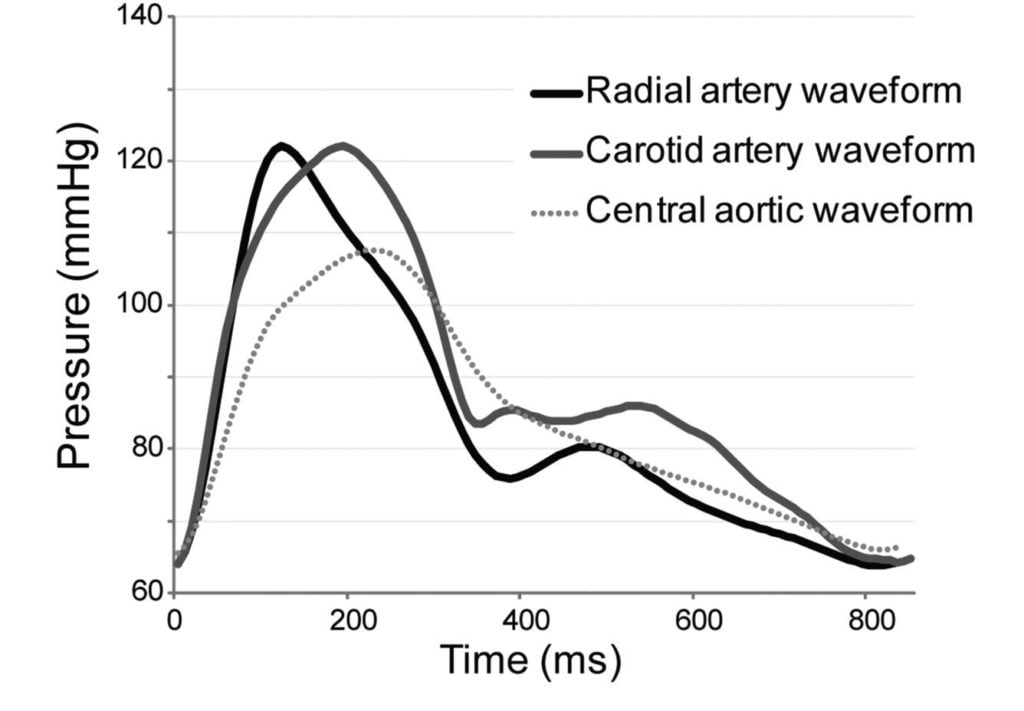
The further you get from the aorta
- The taller the systolic peak (i.e. a higher systolic pressure)
- The further the dicrotic notch
- The lower the end-diastolic pressure (i.e. the wider the pulse pressure)
- The later the arrival of the pulse (its 60msec delayed in the radial artery)
Waveform Difference: Radial vs Aortic
| Radial waveform (vs Aortic) | Reason |
|---|---|
| Delayed start 60msec | · Time taken for wave front to travel (note much faster than blood flow) |
| Narrower and higher systolic component Steeper upstroke = ↑dp/dt max | · Less elastic tissue · Relatively more muscular tissue · ↓ compliance (δv/δp) |
| Lower diastolic component | · Less elastic tissue · Less Windkessel effect (storage and release of energy) |
| Slightly lower mean | · Above factors |
| Widened pulse pressure | · Above factors |
| Disappearance of high freq components | · Damping affects high > low freq · Damping ∝ frictional tissue interactions per length or time |
| Appearance of dicrotic notch | · Reflection and resonance. (peripheral dicrotic notch owes more of its shape to the vascular resistance of peripheral vessels than to the closing of the aortic valve) |
Source: Deranged Physiology, Ketamine nightmares
Examiner Comments
2022B 10: 21% of candidates passed this question.
This question required the integration and understanding of cardiovascular monitoring with what influences the changes as the arterial pulse moves through the vascular tree. In general, the waveforms drawn were often of a poor standard, with little attention given to accurately representing the different shapes, correct axis (pressure and timing) and labelling. The description of the differences was of a better standard however, there were often contradictions between what was drawn and described. For example, several answers correctly described a delay in the systolic peak seen in the radial artery, but this was not illustrated in the diagram. The windkessel effect was often correctly mentioned but not further explained to help describe the changes seen in the waveforms. Interruptions to the arterial traces from the anacrotic and diacrotic notches, the origins of the diacrotic hump, and insuria were often incorrect and poorly explained. The examiners reported that answer template structure was not a major issue, but a lack of integration of the waveform and translation of that knowledge into a description of the cardiac cycle was often poorly done.
2016B 17: 41% of candidates passed this question.
A well labelled diagram drawn clearly to demonstrate the salient features of the aortic and radial arterial pulses was expected. This would include the different systolic pressure, the absence of a dicrotic notch in the radial pulse (instead a diastolic hump), the narrowness and the delay of the radial pulse, garnered many marks.
Marks were lost for insufficient explanation such as the distance needed to travel for the pressure wave accounting for the delay, the sharper rise and decline of the radial pulse due to loss of the WIndkessel effect and the different compliance and the loss of the dicrotic notch due to summation and damping out of high frequency components of the pressure wave.
2018A 18
Compare and contrast non-invasive oscillometric and invasive arterial blood pressure monitoring.
CICMWrecks Answer
NIBP
Invasive BP
Overview
Cuff applied on arm, connected to an inflating device, and Koratkoff sounds are heard to determine BP
arterial catheter connected to a pressure transducer
Uses
BP measurement (SBP,DBP)
- blood pressure (systolic, diastolic, mean and pulse pressure)
- arterial blood sampling
Specific Indications
BP monitoring
- Labile blood pressure
- Anticipation of haemodynamic instability
- Titration of vasoactive drugs
- Frequent blood sampling
- Morbid obesity (unable to fit an appropriately sized NIBP cuff)
Description / Components
- Two cuffs
- Occlusive cuff
- Measurement cuff
- Tubing
- Device for inflating the occlusive cuff and gradually deflating it
- Aneroid barometer for transducing pressure
- Display
- arterial line
- 48 inches of non-compressible rigid-walled, fluid filled tubing
- pressure transducer and automatic flushing system
- pressure bag and automated slow infusion (1-3mL/h) of pressurised saline
- electronic transducer amplifier display
Method of Insertion / Use
- Cuff is inflated until the radial pressure is no longer palpable
This is approximates SBP. - Cuff is deflated, and reinflated to 20mmHg above the estimated SBP
- Cuff is deflated at a rate of 2-3mmHg.s-1 whilst auscultating the brachial artery
When cuff pressure equals:- SBP
Turbulent flow occurs past the cuff, turbulent flow causes the first of the Korotkoff sounds (clear tapping pulsations) to be heard. - DBP
The cuff no longer compresses the vessel at all, so no turbulent flow occurs and nothing is auscultated.
- SBP
- fluctuations of vascular pressure cause a pulsation of the saline column
- displaces electromanometer’s diaphragm which has a built in strain gauge (Wheatstone bridge principle)
- deformation leads to a change in resistance of the strain gauge which is sensed electronically
- wave form built up by Fourier analysis from sinusoids or simple wave forms
- wave forms differ depending on where the cannula is inserted
Needs Calibrating (‘zeroing’) and Square wave test (aka fast flush test) to check for damping of system
Accuracy and Errors
- Requires an appropriately sized cuff
Cuff should be ~20% greater than arm diameter.- Cuffs that are too small will over-read
- Cuffs that are too wide will under-read
- Requires a regular rhythm
- Inaccurate at extremes of blood pressure
- Inaccurate when used more frequently than once per minute
- Inaccurate when the vessel is incompressible
- Heavily calcified vessels
- When applied to forearm/foreleg
- Time consuming, cannot provide continuous monitoring
- Does not require calibration
Common sources of error
- Cannula insertion/position error
- bubbles in catheter-transducer system → decreased resonant frequency
- clotting in arterial catheter
- elastic walls causes increased damping
- Transducer not levelled (Not calibrated properly)
- cannula won’t flush – kinked, clotted, tissued
Complications
- Pain
- Local pressure injury
- May cause neuropraxia
- Pain
- thrombosis and distal ischaemia
- infection
- increased diagnostic blood loss and anemia
- retrograde air embolism
- inadvertent drug/air injection
- haematoma (+/- nerve compression)
- retroperitoneal haematoma (femoral)
- bowel perforation (femoral)
- vessel damage may lead to stricture and prevent future AV fistula formation for haemodialysis
- pseudo-aneurysm
- arterial dissection
- arteriovenous fistula
Other Information
- MAP can be calculated
- Variation seen at different limbs
Information other than blood pressure can be obtained:
- pulse rate and rhythm
- effects of dysrhythmia on perfusion
- ECG lead disconnection
- continuous cardiac output using pulse contour analysis
- specific wave form morphologies might be diagnostic
— e.g. slow rising = AS, pulsus alternans = tamponade - pulse pressure variation (suggests fluid responsiveness)
- steeper upstroke of pulse pressure = increased contractility
- area under upstroke = SV
- steep downstroke = low SVR
Variation in arterial waveform at different sites
JC 2019
Examiner Comments
2018A 18: 52% of candidates passed this question.
There were some good answers, though invasive BP measurement was better answered than oscillometry. Many candidates provided extensive detail in one area i.e. the workings of a Wheatstone bridge, to the detriment of a balanced answer. Few seemed to have a structure consisting of “equipment, method, sources of error, advantages, disadvantages” or similar and missed providing important information as a result. Several described auscultatory non-invasive blood pressure measurement, rather than oscillometry, which although related in principle is a different process.
2020A 12
Explain resonance and its significance and the effects of damping on invasive arterial blood pressure measurement.
2017B 17
Define and explain damping, resonance, critical damping and optimum damping
2015A 12
Describe the effects of resonance and damping on an invasive arterial blood pressure tracing.
2012A 24
Describe the potential causes, and effects, of resonance and damping on an invasive arterial blood pressure trace.
CICMWrecks Answer
Definitions
Natural frequency: the frequency at which a system oscillates when not subjected to a continuous or repeated external force.
Resonance describes the phenomenon of increased amplitude that occurs when the frequency of a periodically applied force (or a Fourier component of it) is equal or close to a natural frequency of the system on which it acts.
Resonant frequency: The frequency of a dynamic system at which the amplitude of response to an oscillating force is a relative maximum is known as a resonant frequency (OR) A natural frequency of vibration determined by the physical parameters of the vibrating object.
Damping: the property of a system that diminishes resonance.
Critical Damping: Occurs when the damping coefficient (DC or γ gamma) is equal to the undamped resonant frequency of the oscillator.
Optimum Damping: Level of damping which provides a compromise between the speed of the system with its accuracy
Undamped simple harmonic oscillator
- obeys hooke’s law
- motion is sinusoidal in time
- demonstrates a single resonant frequency.
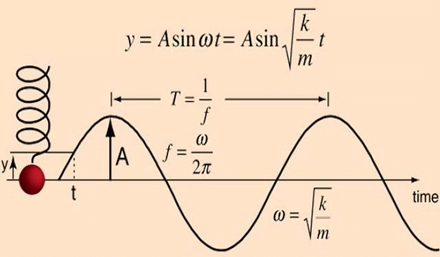
Resonance
Invasive arterial blood pressure is a driven harmonic oscillator
- An external force (pulsations of the heart) adds to the oscillations of the system (the tubing/transducer etc).
- If the frequency of the driving force is similar to, or a harmonic of, the natural frequency of the system then the result is amplification
Arterial waveform is a complex summation of multiple simple sinusoidal waveforms (a fourier series)
- The frequency of the arterial wave (i.e., the pulse rate) is known as the natural or fundamental frequency
- The sine waves used to reproduce it must have a frequency that is a multiple (or harmonic) of the fundamental frequency
- Increasing the number of harmonics allows better reproduction of high-frequency components, such as a steep systolic upstroke
In most clinical systems
- Natural resonant frequency is 10 to 15 Hz
- Primary frequency of the arterial waveform (the heart rate is 60 to 120 bpm or 1 to 2 Hz)
- However the higher frequency components of the more complex arterial waveform are closer to the natural resonant frequency and are amplified to a larger degree.
To minimize the potential of amplification and improve the dynamic accuracy of the real arterial pressure, system should have resonant frequency >> than 6-8 times frequency of the system being measured:
- Should have noncompliant (i.e. stiff) tubing
- Total mass of liquid in the system should also be minimized (shorter/thinner tubes)
- air bubbles or blood clots or occlusion should be eliminated
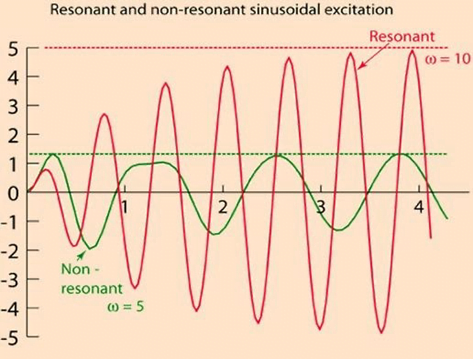
Damping
the property of a system that diminishes resonance.
- Damping:
- decreases the magnitude of the oscillations
- allows the system to come to rest at a new value.
- Degree of damping determines the rate at which the system achieves that new value.
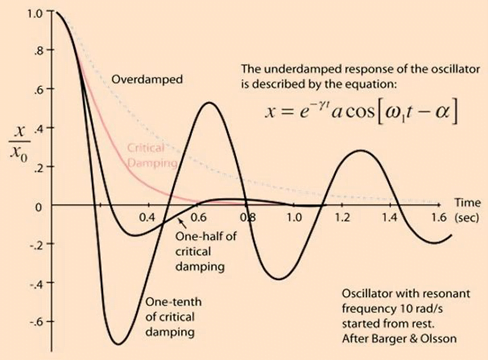
System can be:
- Underdamped (DC < 0.7):
- Reaches the zero position quickly
- Oscillates around it
- Causes falsely ↑ SBP and falsely ↓ DBP
- Critically damped (DC = 1):
- Quickest approach to zero amplitude for a damped oscillator without overshoot.
- Occurs when the damping coefficient (DC or γ gamma) is equal to the undamped resonant frequency of the oscillator.
- Optimal damping (DC = 0.64):
- Provides a compromise between the speed of the system with its accuracy
- Minimises overshoot of oscillations, phase and amplitude distortion, and provides maximal frequency response
- Overdamped (DC > 1):
- The approach to zero is slower
- Very slow to respond
- Causes falsely ↓ SBP, falsely ↑ DBP and loss of fine details of waveform (Eg. dichrotic notch)
Bedside Flush Test:
- The degree of damping in an invasive arterial line system can be determined by the bedside flush test
- Briefly open the continuous flush device to produce a square wave
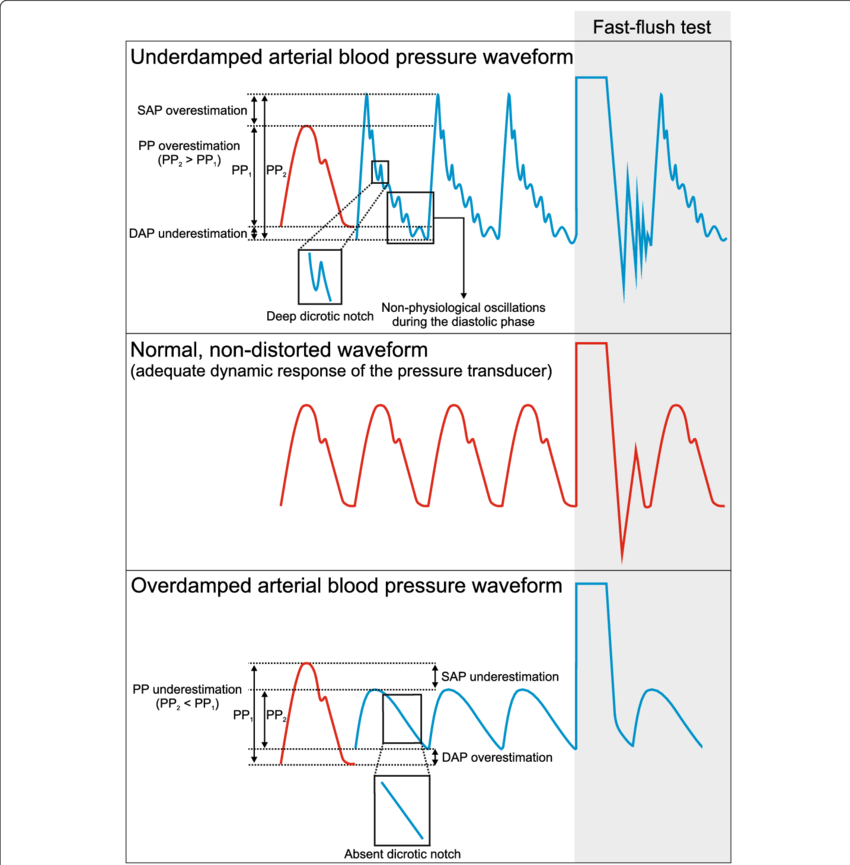
Gladwin / Sakurai / JC 2020
Examiner Comments
2020A 12: 23% of candidates passed this question.
Many candidates gave detailed answers that involved the set up and components of the arterial line system that was not asked for in the question and did not attract marks. There was confusion around the correct use of the terms natural frequency, resonance frequency and harmonics – candidates that were able to describe these frequencies correctly went on to achieve a good mark – the graphs and discussion around optimal dampening, over and underdamped traces were often drawn poorly or without sufficient detail, and at times were not used within in the context of the answer. Descriptions of the clinical effect seen with over / under dampened traces on blood pressure was well described.
2017B 17: 25% of candidates passed this question.
Concise definitions were required with a clear explanation of the underlying physical principles. The response time of the system, degree of overshoot, effect on amplitude, noise and ability to faithfully reproduce frequencies relative to the natural resonant frequency were important considerations. Many candidates interpreted the question as relating to arterial lines and a detailed discussion of the components and characteristics of an intra-arterial catheter and transducer system did not attract marks
2015A 12: 33 % of candidates passed this question.
Many candidates seemed to get some of the basic concepts but few were able to expand on simple concepts.
It was expected that candidates could describe that the arterial pressure waveform is made up of many different sine waves (as determined by Fourier Analysis) with each sine wave having a specific frequency. Every system has its own natural oscillatory frequency, or resonant frequency. If this is less than 40 Hz, it falls within the range of frequencies present in the blood pressure waveform and oscillations may produce a sine wave which is superimposed on the blood pressure wave form.
Some damping is inherent in any system and acts to slow down the rate of change of signal between the patient and pressure transducer. It may be caused by air bubbles or blood clots or occlusion. This reduces the deflection of the transducer diaphragm and hence the size of the waveform. The effect of damping on temporal response was rarely mentioned. Accurate graphical representations of invasive pressure traces are important. Many candidates provided poor drawings without axis, labels, reference to normal or discussion in text.
2012A 24: 3 (30%) of candidates passed
For a good answer candidates were expected to mention that the arterial pressure waveform is made up of many different sine waves (as determined by Fourier Analysis) with each sine wave having a specific frequency. Every system has its own natural oscillatory frequency, or resonant frequency. The pressure measuring system has a resonant frequency at which oscillations occur, and if this is less than 40 Hz, it falls within the range of frequencies present in the blood pressure waveform and oscillations may produce a sine wave which is superimposed on the blood pressure wave form. The resonant frequency can be increased by using a short, wide, stiff catheter. In respect to damping, some damping is inherent in any system and acts to slow down the rate of change of signal between the patient and pressure transducer. Mention of causes of damping and the optimal damping coefficient (0.677) were expected. An under-damped system is one whereby resonance occurs causing the signal to oscillate and overshoot (damping factor <0.7) and an overdamped is one whereby the signal takes a long time to reach equilibrium but will not overshoot. It may not reach equilibrium in time for a true reading to be given (damping factor >1.0). Both resonance and damping can alter the measured systolic and diastolic values but the mean pressure is not affected
iii. Describe the methods of measurement of cardiac output including limitations, potential sources of error, the need for calibration and the values obtained.
2017B 10
Compare and contrast two methods of measuring cardiac output
2014A 19
Define cardiac output. (10% of marks) Outline the factors that affect cardiac output. (60% of marks) Briefly describe the thermo dilution method of measuring cardiac output. (30% of marks)
2011A 12
Describe the principles, and limitations, of the measurement of cardiac output using an indicator dilution technique
CICMWrecks Answer
Cardiac Output
Cardiac output = Volume of blood ejected by the heart per unit time (minute)
HR determined by autonomic input
- Resting HR approx 60
- Sympathetic blockade causes HR to slow to 50
- Sympathetic output to heart governed by the medullary vasomotor area
- Parasympathetic blockade causes HR to hasten to 110
- Both sympathetic and parasympathetic blockade causes HR to hasten to 100
- Electrolytes
- Drugs
- Sympathetic blockade causes HR to slow to 50
SV = Amount of blood ejected by the heart per contraction
Governed by:
- Preload
- Tension applied to myocyte immediately prior to contraction
- Starling relationship
- Optimal sarcomere length ~2.2um
- Over-stretch inhibited by fibrous pericardium
- Preload governed by
- Blood volume and MSFP (increases preload)
- RAP (decreases preload)
- Resistance to venous return (decreases preload)
- Negative intrathoracic pressure (aids in venous return)
- Musculovenous pumps (aids in venous return)
- One-way venous valves (aids in venous return)
- Starling relationship
- Tension applied to myocyte immediately prior to contraction
- Afterload
- Load against which the ventricle must exert its contractile force
- According to Laplace law
- Afterload ∝ (Aortic pressure x ventricular radius) / thickness of ventricular wall
- Other factors affecting afterload
- Resistance
- Viscosity inversely proportional to flow
- As viscosity decreases (e.g. Hb decrease), output increases
- Flow is proportional to vessel radius to the 4th power
- Viscosity inversely proportional to flow
- Resistance
- Contractility
- Intrinsic ability of myocardium to contract at given preload and afterload
- Governed
- Sympathetic increases contractility
- Parasympathetic decreases contractility
- Other hormones
- Electrolytes
Measurement
Cardiac output measurement can be performed:
- Invasively
- Pulmonary Artery Catheter
- Thermodilution
- Fick Principle
- Indicator Dilution Technique
- TOE
- Arterial waveform analysis
- PiCCO
- FloTrak/Vigileo
- Acumen/Hemosphere
- Pulmonary Artery Catheter
- Non-invasively
- TTE
- MRI
- Thoracic impedance
Thermodilution
Indicator Dilution (Stewart-Hamilton)
Introduction
Invasive
Thermodilution remains the gold standard of cardiac output measurement.
Invasive
Equipment
Pulmonary Artery Catheter
- A proximal port at the RA/SVC
- A temperature probe at the tip: Typically a silicon oxide thermistor.
- A balloon at the tip: To float it into position.
- A distal (PA) port is required for measuring PAP and the PCWP, but is not required for CO calculation
Can also be done using other devices like PiCCO
- dyes: indocyanine green, isobestic or radioactive isotope.
- Catheter for injection
- Arterial Sampling catheter
- Measurement device
Method / Theoretical Basis
- Catheter passed into right atrium
- Known quantity of fluid of known temperature injected into right atrium
- Second catheter in pulmonary artery
- Measured change in temperature
- Change in temperature over time graphed
- Return of temperature to baseline extrapolated to zero to account for
recirculation - Average change in temperature for duration of curve calculated
- CO = temperature of indicator / (average change in temp x duration of curve)
Method:
- rapidly inject 10mL of dye into venous circullation in RA.
- indicator mixes quickly with cardiac contents.
- during next few beats, blood-indicator mixture is measured by continual sampling from proximal artery in arm for one complete circulation (30 seconds).
- mean concentration of mixture for one circulation determined.
Q = amount of indicator injected / indicator concentration over time.
Assumptions:
- retention of indicator
- complete mixing
- constant flow rate
Advantages / Disadvantages / Errors
Advantages:
- Simple
- No toxicity
- Repeated measurements possible
Disadvantages / Errors:
- Natural variability (reduced by using mean of 3-5 measurements)
- Issues with incorrect volume and temperature of injectate
- Improper positioning of PAC and complications associated with insertion and use
- Tricuspid regurgitation
Results in retrograde ejection of injectate back past the valve. - Arrhythmia
Advantages:
- rapid Q determination
Disadvantages:
- need to continuously withdraw arterial blood to plot the concentration curve.
- dye can build up.
- intracardiac shunt will effect recirculation.
Sakurai / JC 2019
Examiner Comments
2017B 10: 35% of candidates passed this question.
Good answers began with a definition of cardiac output. For each method, it was expected that candidates discuss the theoretical basis, equipment, advantages and disadvantages / sources of error and limitations. Additional marks were awarded when an attempt was made to compare and contrast the two methods (often helped by the use of a table).
2014A 19: 58% of candidates passed this question.
This is a core question. It was expected candidates could provide a definition (heart rate x stroke volume) and then move on to outline factors that affect it (afterload, preload, contractility). Additional marks were awarded for descriptions of the relationship to mean systemic filling pressure and other influences beyond this. Most candidates described a thermodilution cardiac output curve but almost all described the technique as based on the “Fick equation or method” (which is used to estimate cardiac output from oxygen consumption). Very few candidates correctly identified the Stewart Hamilton equation as the integration method used to relate cardiac output (flow) to temperature change as an example of indicator dye dilution. Candidates seemed to lack depth and understanding on this topic.
2011A 12: 7 (58%) of candidates passed this question.
Most candidates chose to describe the thermodilution technique of cardiac output measurement. Descriptions of other techniques and indicators such as dye dilution using indocyanine green were acceptable alternatives.
Better answers included a description of the Fick Principle and the fact that it is based on the law of conservation of matter. For thermodilution, heat lost from the blood = heat gained from the injectate. Also required were an accurate description of the technique, a description of the indicator-time curve and errors encountered in the technique. For thermodilution these included the requirement for a Swan Ganz catheter, nature and temperature of the injectate, temperature measurement using a thermistor in the pulmonary artery and an appreciation that it is the curve of a
decrease in temperature versus time that is being analysed.
Syllabus: S2c
Recommended sources: Anaesthesia, Miller, Chp 40

Recent Comments