Syllabus (Fourth Edition, 2023)
Topics
i. Describe the measurement and interpretation of pulmonary function tests.
ii. Describe the carbon dioxide and oxygen response curves and how these may be used to assess the control of breathing.
iii. Understand respiratory equations that describe ventilation, perfusion, blood flow and respiratory mechanics.
Topics not covered in previous SAQs
i. Describe the measurement and interpretation of pulmonary function tests.
ii. Describe the carbon dioxide and oxygen response curves and how these may be used to assess the control of breathing.
iii. Understand respiratory equations that describe ventilation, perfusion, blood flow and respiratory mechanics.
Learning Objectives for the First Part Examination in Intensive Care Medicine
- This will ensure that trainees, tutors, and examiners can work from a common base.
- All examination questions are based around this Syllabus.
- These learning objectives are designed to outline the minimum level of understanding required for each topic.
- The accompanying texts are recommended on the basis that the material contained within them provides sufficient information for trainees to meet the learning objectives.
- Trainees are strongly encouraged to explore the existing and evolving body of knowledge of the Basic Sciences as they apply to Intensive Care Medicine by reading widely.
- For all sections of the syllabus an understanding of normal physiology and physiology at extremes of age, obesity, pregnancy (including foetal) and disease (particularly critical illness) is expected.
- Similarly, for pharmacology, trainees are expected to understand a drug’s pharmacology in these contexts.
- An understanding of potential toxicity and relevant antidotes is also expected.
Definitions
Throughout the document specific wording has been used under the required abilities to indicate the level of knowledge and understanding expected and a glossary of these terms is provided.
Definitions
| Calculate | Work out or estimate using mathematical principles. |
| Classify | Divide into categories; organise, arrange. |
| Compare and contrast | Examine similarities and differences. |
| Define | Give the precise meaning. |
| Describe | Give a detailed account of. |
| Explain | Make plain. |
| Interpret | Explain the meaning or significance. |
| Outline | Provide a summary of the important points. |
| Relate | Show a connection between. |
| Understand | Appreciate the details of; comprehend. |
SAQs
i. Describe the measurement and interpretation of pulmonary function tests.
2012A 13
Draw (include labels and normal values) a normal spirometry trace in a young adult (20% of marks).
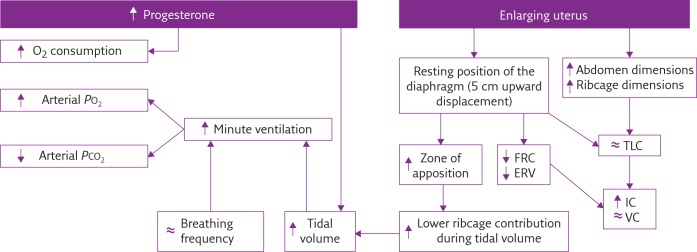
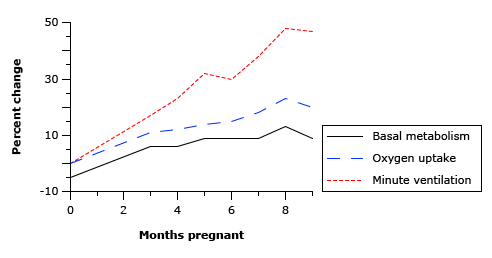
Describe the changes seen in the spirometry, and the respiratory system overall, in pregnancy at term (80% of marks).
CICMWrecks Answer
Normal Spirometry trace

| Inspiratory reserve volume | 45ml/kg | 3 L |
| Tidal volume | 7ml/kg | 500 ml |
| Expiratory reserve volume | 15ml/kg | 1.1 L |
| Residual volume | 15ml/kg | 1.1 L |
| Total Lung Capacity | 82ml/kg | 5.7 L |
| Vital Capacity | 67ml/kg | 4.6 L |
| Functional Residual Capacity | 30ml/kg | 2.2 L |
In Pregnancy
Anatomical
- Diaphragm ascends ~4cm due to foetus
- AP and lateral diameters of thorax increase 2~3cm due to relaxin effect on chest
wall - Thoracic circumference increases 5~7cm (AP and lateral diameters increased 2~3cm)
- Airway dilatation → decreased resistance (35%) and increased deadspace (45%)
- Increased cardiac output, intravascular volume, and decreased oncotic pressure
- Increased plasma volume → increased pulmonary blood volume → decreased compliance
- Venous engorgement → Upper airway oedema
Mechanical
- Lung volume changes occur from 20 weeks
- TLV decreases 5% from baseline
- FRC decreased 20% due to both ERV and RV
- Significant postural change in FRC of 70%
- Progesterone → increased sensitivity to CO2 → Minute ventilation increases 50%
- TV increases (25%)
- RR increases
- Results in hypocarbia and compensated respiratory alkalosis
- pCO2 ~ 26-32mmHg
- HCO3 ~ 18-20mmol/l
- Further increase in MV during contractions
- Inspiratory capacity increased by 10%
- Closing capacity unchanged
- Increased O2 consumption during labour (60%)
After birth
- FRC and RV return to normal within 48 hours
- TV returns to normal within 5 days


Sakurai 2016
Examiner Comments
2012A 13: 5 (50%) of candidates passed.
This question was generally handled well. Significant variation exists in normal values between textbooks, and examiners took account of this variation. Some candidates failed to provide any normal values or gave values not in accord with the traces they provided. Some candidates confused spirometry (volume/time) with flow volume loops or even a forced expiratory volume trace. These scored no marks. The second part was not well answered by some candidates with failure to describe changes – or even contradicting correctly graphed changes (for example the reduction in residual volume with pregnancy described as increased). Memorising curves needs to be accompanied by understanding. No marks were awarded for detailed discussion of the Haldane effect, as this was not asked. Candidates are reminded to read and answer the question.
2017B 18
Draw and numerically label, on a spirogram, the lung volumes and capacities of a 30 kg child
CICMWrecks Answer

| Volumes | per kg | 30kg Child |
|---|---|---|
| Inspiratory reserve volume | 45ml/kg | 1.35 L |
| Tidal volume | 7ml/kg | 210 ml |
| Expiratory reserve volume | 15ml/kg | 450 ml |
| Residual volume | 15ml/kg | 450 ml |
| Total Lung Capacity | 82ml/kg | 2.46 L |
| Vital Capacity | 67ml/kg | 2.01 L |
| Functional Residual Capacity | 30ml/kg | 900 ml |
JC 2020
Examiner Comments
2017B 18: 87% of candidates passed this question.
This core respiratory physiology topic was well answered by most candidates. Candidates
generally were able to draw a spirogram. A common omission was inspiratory capacity.
2011B 18
Outline the abnormalities in pulmonary function testing of a person with severe obstructive lung disease (40% marks).
Describe the physiological changes that explain these abnormalities (60% marks).
CICMWrecks Answer
Obstructive Lung Disease
e.g. Asthma, COPD
| Pulmonary Function Test | Obstructive Lung Disease |
|---|---|
| Total lung capacity (TLC) | ↑ |
| Residual volume (RV) | ↑ |
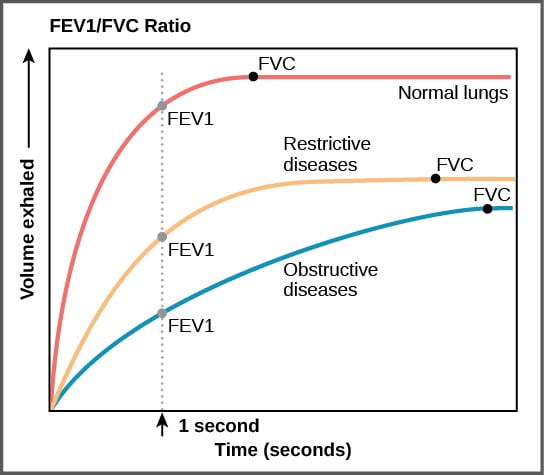
| Forced vital capacity (FVC) | ↓ |
| Forced Expiratory Volume in 1st second (FEV1) | ↓↓ |
| FEV1 / FVC Ratio | ↓ , <80% |
| Maximum Voluntary Ventilation | ↓ |
| RV / TLC | ↑ |
| PEFR Peak Expiratory Flow Rate | ↓ |
| FEF 25-75% Forced expiratory flow at 25–75% of forced vital capacity | ↓ |
Physiological changes
- ↑ AWR caused by bronchial SM contraction, secretions, wall oedema, and reduced radial traction (from damaged lung parenchyma)
- Closing capacity rises towards or > FRC
- ↓ elastic potential energy is stored to generate driving pressure gradient (this is caused by ↑ lung compliance resulting from damaged lung parenchyma)
Thus
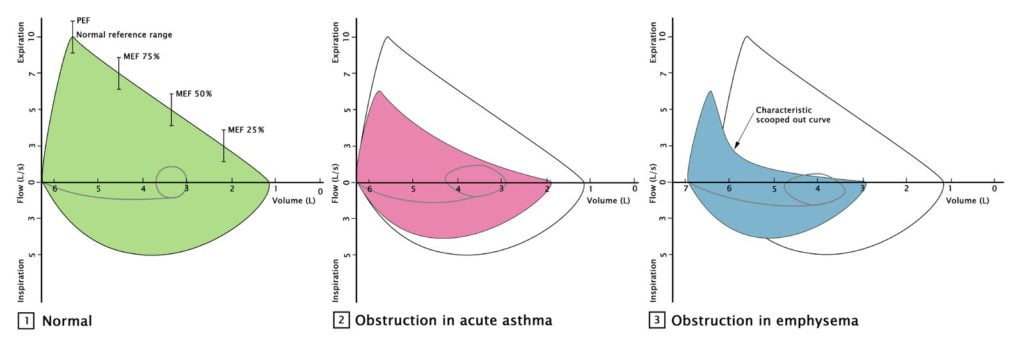
- ↓ FRMAX and ↓ steep rise in expiratory FR during effort-dependent part of the curve
- ↓ steep and “scooped” appearance of flow curve in effort-independent part of the curve due to dynamic airway compression occurring at higher lung volumes
Pulmonary function tests:
- Peak Flow
- Reduced PEF rates
- Simple spirometry:
- shows an increase in lung volumes
- decreased inspiratory capacity
- (increased FRC but not measured)
- Forced expired spirometry is diagnostic
- FEV1/FVC < 70%
- FEV1 % predicted <50%
- FEF 25 – 75% is prolonged
- Flow volume loops
- higher volumes
- decreased flow
- scooped effort dependent portion

https://www.wikidoc.org/index.php/File:Figure_39_03_05f.jpg

https://www.amboss.com/us/knowledge/Pulmonary_function_testing/
Gladwin 2016
Examiner Comments
2011B 18: 0 (0 %) of candidates passed this question.
The majority of candidates were able to state that obstructive lung disease resulted in a reduction in the FEV1 and the FVC. Very few gave any indication of how much these parameters might be reduced in severe obstructive lung disease or that FVC is usually only slightly reduced, whereas the FEV1 is markedly reduced and therefore so is the FEV1/FVC ratio. Candidates were also expected to indicate that peak expiratory flow rate is also reduced (by 50% or more in severe disease), that carbon monoxide diffusing capacity is also reduced, and residual volume and total lung capacity are increased. A reasonable proportion of candidates commented that the forced expiratory flow (FEF) 25-50% being reduced and this results in a ‘scalloped’ flow volume loop. Accurately reproducing a normal flow volume loop and a flow volume loop of a patient with severe obstructive lung disease on the same graph could have depicted most of the above points and scored the majority of marks available.
The second part of this question was poorly answered. Whilst the majority correctly stated that an increase in airways resistance was present, few stated what changes gave rise to this. Dynamic airway compression, was mentioned by many, but why this occurred was explained poorly. The effect of closing capacity rising above the FRC was seldom mentioned and why the FRC increased again was seldom mentioned or explained. A detailed knowledge of what is a core subject in intensive care medicine was expected.
Syllabus: B1a 2a, b; B1j 2a
Recommended sources: Respiratory Physiology: The Essentials. West 6th Ed pgs 26, 96-99, 131-142.

Recent Comments