Past Papers · SAQ
Carbon Dioxide Monitoring — Capnography Principles
2026A Q11
Exam questiona) Outline the scientific principles that apply to the measurement of end-tidal carbon dioxide using capnography. Include the techniques of sampling in your answer (30% of marks).
b) Describe a normal capnograph waveform and its features (20% of marks). A diagram may assist you with your answer.
c) Outline the ventilation and perfusion information that can be derived from the capnograph waveform (50% of marks).
CICMWrecks answer
Master answer
a) Scientific principles and sampling (30%)
Measurement principle
- Capnography is the continuous graphical display of exhaled CO2 concentration or partial pressure against time.
- Clinical capnometers usually use non-dispersive infrared absorption.
- CO2 absorbs infrared light strongly at approximately 4.26 μm.
- The measurement follows the Beer–Lambert law: absorbance is proportional to the concentration of the absorbing gas and the optical path length.
- An infrared source passes light through the gas sample to a detector. Increasing CO2 causes greater absorption and therefore less transmitted light; the analyser converts this into CO2 concentration / partial pressure.
- Because water vapour, pressure, temperature and other gases can affect measurement, modern systems use narrow-band filters, calibration and compensation algorithms.
Sampling techniques
| Feature | Mainstream / in-line | Sidestream |
|---|---|---|
| Method | Infrared sensor sits directly in the breathing circuit near the airway. | A small continuous gas sample is aspirated through tubing to a remote analyser. |
| Advantages | Very rapid response; minimal transport delay; waveform is less distorted by sampling tubing. | Lightweight airway adapter; can be used with non-intubated patients via specialised cannulae; analyser is remote from the airway. |
| Limitations | Adds apparatus weight/dead space; secretions or condensation can contaminate the optical window. | Sampling delay and waveform dispersion; tubing may kink, leak or block with water/secretions; aspiration removes a small amount of circuit gas. |
Important measurement errors
- Water/secretions: contaminate sampling lines or optical windows and may distort the signal.
- Leaks / entrained room air: dilute sampled CO2 and lower the measured value.
- Sampling-line obstruction: attenuates or abolishes the waveform.
- Response time / excessive sampling tubing: delays and smooths the waveform, especially at high respiratory rates.
- Gas interference and pressure effects: can alter infrared absorbance; modern analysers compensate for common interferents.
b) Normal capnogram waveform and features (20%)
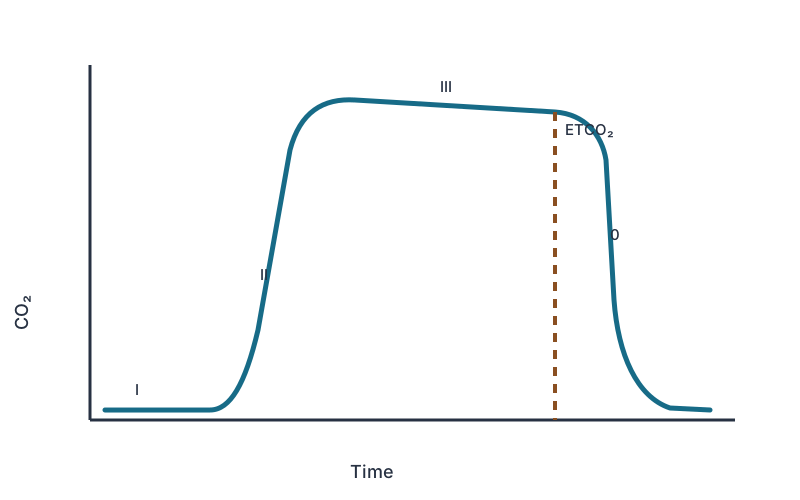
Time capnogram: CO2 partial pressure/concentration on the y-axis versus time on the x-axis.
| Phase | Normal feature | Physiological meaning |
|---|---|---|
| Phase 0 — inspiration | Rapid downstroke to a baseline near zero. | CO2-free inspired gas replaces alveolar gas. |
| Phase I | Inspiratory/early expiratory baseline near zero. | Exhalation of apparatus and anatomical dead-space gas containing essentially no CO2. |
| Phase II | Rapid expiratory upstroke. | Mixing of dead-space gas with progressively increasing alveolar gas. |
| Phase III | Alveolar plateau with a small positive slope. | Predominantly alveolar gas; the slope reflects sequential emptying of alveoli with different time constants and V/Q ratios. |
- ETCO2 is measured at the end of phase III, immediately before inspiration.
- In healthy lungs ETCO2 is usually slightly lower than PaCO2, commonly by about 2–5 mmHg; the gradient widens when alveolar dead space or V/Q mismatch increases.
- Alpha angle: angle between phases II and III; increases when expiratory time constants become heterogeneous, classically with airflow obstruction.
- Beta angle: angle between phase III and the inspiratory downstroke; an increased beta angle / failure to return to zero suggests CO2 rebreathing.
c) Ventilation and perfusion information derived from the waveform (50%)
Ventilation
| Capnographic finding | What it tells you | Why |
|---|---|---|
| Persistent exhaled CO2 | Supports tracheal rather than oesophageal intubation. | Pulmonary ventilation produces repeated alveolar CO2 waveforms; an oesophageal tube does not sustain them. |
| Respiratory rate | Breath frequency, apnoea and sudden circuit disconnection can be recognised immediately. | Each ventilatory cycle generates one capnogram. |
| ETCO2 trend | Reflects adequacy of alveolar ventilation when CO2 production and perfusion are reasonably stable. | PaCO2 is inversely related to alveolar ventilation; ETCO2 usually tracks PaCO2. |
| Rising ETCO2 | May indicate hypoventilation or increased CO2 production. | Less alveolar ventilation removes less CO2. |
| Falling ETCO2 | May indicate hyperventilation, but must also prompt consideration of reduced pulmonary perfusion. | ETCO2 depends on both ventilation and delivery of CO2 to the lung. |
| Steep phase III / increased alpha angle | Airflow obstruction or heterogeneous alveolar emptying. | Different regional time constants cause sequential emptying of alveoli with differing CO2 concentrations. |
| Inspiratory baseline above zero / increased beta angle | CO2 rebreathing. | Inspired gas contains residual CO2 rather than returning to a zero baseline. |
Perfusion
- ETCO2 approximates alveolar and therefore arterial PCO2 when V/Q matching is relatively normal.
- With ventilation and metabolic CO2 production held approximately constant, the amount of CO2 delivered to alveoli depends on pulmonary blood flow / cardiac output.
- Therefore a fall in cardiac output reduces CO2 delivery to the lungs and causes a rapid fall in ETCO2; examples include severe hypotension, cardiac arrest and massive pulmonary embolism.
- Conversely, an abrupt sustained rise in ETCO2 during CPR can indicate increased pulmonary blood flow and may suggest return of spontaneous circulation.
- The PaCO2 − ETCO2 gradient widens as alveolar dead space / high-V/Q lung increases because poorly perfused alveoli contribute low-CO2 gas to the exhaled mixture.
- Thus a widening gradient may occur with pulmonary embolism, low cardiac output, excessive PEEP or other causes of reduced pulmonary perfusion.
Integrated V/Q information
- The waveform combines information about ventilation, perfusion and metabolism; ETCO2 must therefore be interpreted in clinical context rather than as a direct substitute for PaCO2.
- Phase III slope reflects heterogeneity of alveolar time constants and V/Q ratios: a steeper plateau suggests uneven emptying, particularly in obstructive lung disease.
- An increased PaCO2 − ETCO2 gradient indicates increased physiological dead space / V/Q mismatch.
- Capnography is excellent for trending rapid physiological change, but a single waveform abnormality is usually not disease-specific.
Exam focus
- Part (a): state Beer–Lambert + infrared absorption + mainstream versus sidestream.
- Part (b): draw the waveform accurately and label phase 0, phases I–III, ETCO2, alpha angle and beta angle.
- Part (c): split your answer into ventilation and perfusion, and explain the mechanism behind every inference rather than merely listing “cardiac output”, “respiratory rate” or “V/Q mismatch”.
Quick reference
Summary
| Feature | High-yield point |
|---|---|
| Measurement | Infrared absorption at ~4.26 μm using the Beer–Lambert relationship |
| Sampling | Mainstream = in-line rapid response; sidestream = remote analyser with transport delay / sampling-line errors |
| Normal waveform | Phase 0 inspiration; I dead space; II expiratory upstroke; III alveolar plateau; ETCO2 at end of III |
| Ventilation | ETCO2 trend, respiratory rate, tube position, rebreathing, obstruction and heterogeneity of alveolar emptying |
| Perfusion | With ventilation/metabolism stable, ETCO2 trends with pulmonary blood flow / cardiac output; PaCO2−ETCO2 gradient widens with alveolar dead space |
Past papers
Exam appearances
| Exam | Exact exam wording | Candidate success |
|---|---|---|
| 2026A Q11 | a) Outline the scientific principles that apply to the measurement of end-tidal carbon dioxide using capnography. Include the techniques of sampling in your answer (30% of marks). b) Describe a normal capnograph waveform and its features (20% of marks). A diagram may assist you with your answer. c) Outline the ventilation and perfusion information that can be derived from the capnograph waveform (50% of marks). | 48.2% |
| 2023A Q03 | Outline the principles of measurement of end-tidal CO2 using infrared radiation (25% of Marks). Describe the potential sources of error when using this modality and how they may be mitigated (75% of Marks). | 21% |
| 2019B Q10 | Describe the principles of capnography, including calibration, sources of error and limitations. | 31% |
| 2015B Q09 | Describe the principles of measurement of end-tidal CO2, including the sources of error. | 19% |
| 2010A Q04 | Describe the underlying principles involved in the measurement of end tidal CO2 (by infrared analysis), including sources of error and interference. | 10% |